Web Performance Optimization
I have almost 20 years of experience in web page performance optimization. My specialties are raw javascript, compression, and rendering strategies to maximize page metrics that drive engagement, SEO improvement, and revenue. Contact me if you need help optimizng your project. Starting costs for any optimization consulting are $3,000 and requires that you are cool, and your project is cool. If you are cool, I want to help.
Helpful Resources
- Page Doctor — my new page analysis tool for page speed and SEO
- Milliseconds Make Money
- CLS to 0 with 10 lines of code
- Why jQuery hurst page performance
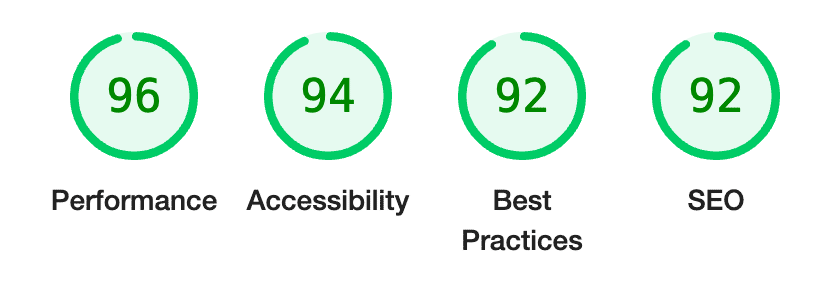
WilliamBelk.com Page Speed Score
Web Page Speed Optimization Overview
Web page performance optimization is some blend of art and science. The goal is to improve page load both technically, and visually.
As our page speed improves, we see so many compounding benefits like:
- Visitor trust, good will, and satisfaction increase
- Bounce rate decreases (how many people exit very near to when the page finishes loading)
- Visitor engagement and clicks increase
- Page views increase
- 'Add to carts' increase
- Conversion increases
- SEO rank improves
- Ad cost decreases because landing page Quality Score improves
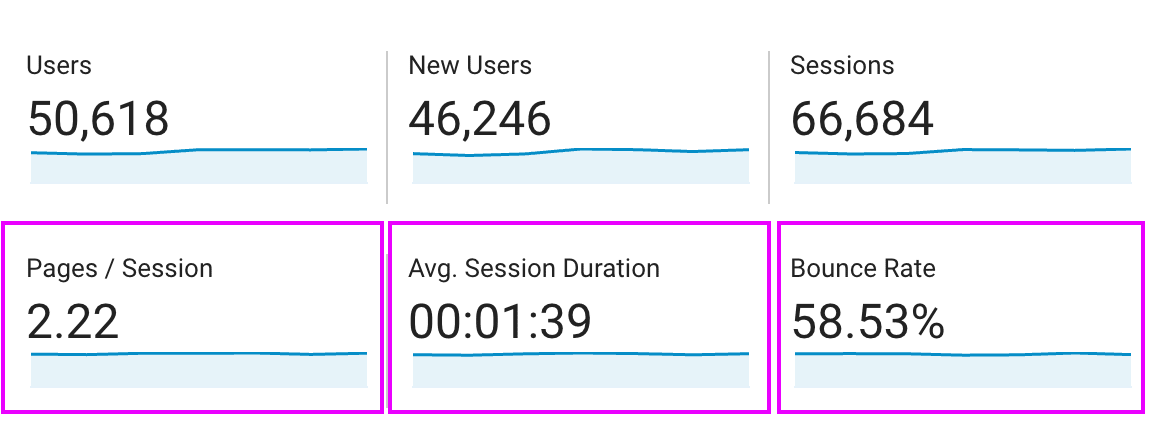
The main user performance metrics that we look at to validate our successful page speed optimization efforts are:
- Bounce Rate
- Bounce Rate is the rate at which people exit your page before scrolling or interacting. Higher Bounce Rate is bad, lower Bounce Rate is good. Bounce Rate is massively affected by page load rendering speed — in Google Pagespeed Insights, the two main metrics we look at are First Contentful Paint and Total Blocking Time.
- Time On Page
- Visitor time on page or Session Duration naturally improve up as Bounce Rate goes down. In effect, when Bounce Rate goes down, more visitors have "stuck" to a page and landed successfully. Bounce Rate goes down as page speed improves.
- Pages Per Visit
- We want to validate that improved Bounce Rate and Time On Page or Session Duration increases Pages Per Visit/Session.
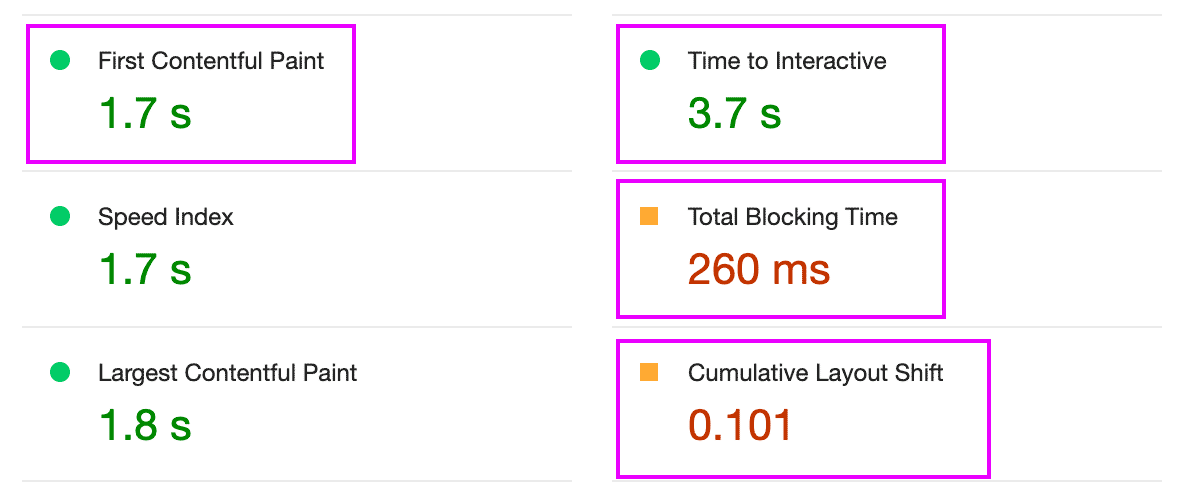
The main technical page speed metrics that we look at to validate our successful page speed optimization efforts are:
- First Contentful Paint
- First Contentful Paint measures how long it takes for the first graphical rendering of the page to start, i.e. when the first text, image, color, or shape is drawn in the browser. The faster this happens, the better. First Contentful Paint is primarily affected by network latency, server speed to return the requested assets, and any blocking requests that prevent the browser from continuing. A blocking request is a request for an asset (like a file) that is improperly configured to tell the browser "Do not complete any more rendering tasks until this file's contents are loaded to the page and placed into memory. If any code lower on the page executes before this file is loaded, the page will break."
- Total Blocking Time
- Blocking Time measures the amount of time the rendering thread of the browser is "blocked" by loading an essential resource. A blocking request is a request for an asset (like a file) that is improperly configured to tell the browser "Do not complete any more rendering tasks until this file's contents are loaded to the page and placed into memory. If any code lower on the page executes before this file is loaded, the page will break."
- Time To Interactive
- Time To Interactive means the amount of time all eseential javascript on the page takes to load and initialize. This is very important as Google has a hard time distinguishing between eseential and non-essential javascript resources.
- Cumulative Layout Shift
- Cumulative Layout Shift (CLS) is the measure of how much elements either shift or grow on the page. These movements cause eye strain and disrupt the visitor's eye flow on the page. Lower CLS is always better.
Important Concepts
Google PageSpeed Score Is The Least Important Metric
The only way to improve a page is to improve individual metrics.
Javascript Dependencies Like jQuery Destroy Page Load Performance
Why jQuery hurst page performance
Well written, raw javascript, is always the best for page speed peformance. External javascript library depencies almost always require that the library be loaded to the page before any essential rendering operations can be performed. This will always negatively impact Total Blocking Time and Time To Interactive.